- Berkshire Hathaway's upcoming Q2 earnings report on August 8, 2026, is highly anticipated, with analysts forecasting earnings of $5.04 per share and revenue of $96.52 billion.
- The company's significant stock buybacks, potentially up to $11 billion, signal strong management confidence in the stock's intrinsic value.
- Berkshire Hathaway demonstrates robust financial health with a low Debt-to-Equity ratio of 0.20 and strong liquidity, alongside key valuation metrics like a P/E ratio of 15.45 and an earnings yield of 6.47%.
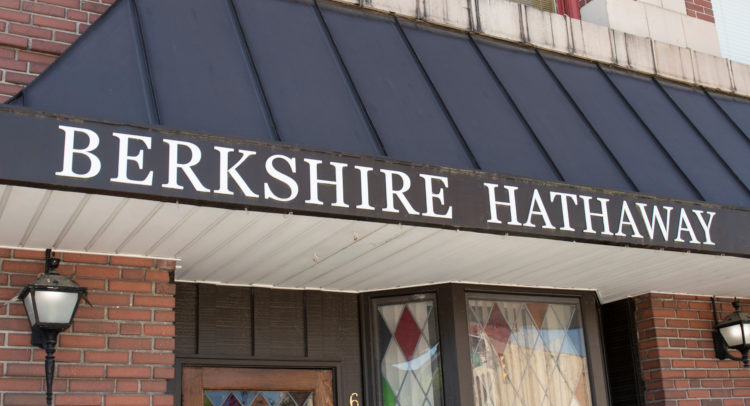
Berkshire Hathaway (NYSE:BRK-B) is a major holding company with a wide range of businesses, including insurance, railroads, and energy. Led by CEO Greg Abel, the company follows the value-focused investment strategy of its famed predecessor, Warren Buffett. Investors are now watching for its next financial report.
On August 8, 2026, Berkshire Hathaway is set to release its second-quarter earnings. Wall Street analysts forecast earnings of $5.04 per share for this period. The revenue estimate is also significant, projected to be around $96.52 billion. This release will provide a clear update on the company's performance.
Ahead of the earnings, Berkshire Hathaway has been active in buying back its own stock. The company may have repurchased up to $11 billion in shares, as highlighted by Barrons. This action signals that management believes the stock is trading below its true worth, a core part of its capital strategy.
Current valuation metrics provide context. Berkshire Hathaway has a Price-to-Earnings (P/E) ratio of 15.45 and a Price-to-Sales (P/S) ratio of 2.98. These ratios help investors assess the stock's price relative to its earnings and revenue, respectively. The company also shows an earnings yield of 6.47%.
The company's financial health appears strong. It has a low Debt-to-Equity ratio of 0.20, which means it relies more on owner's funds than debt. Its Current Ratio of 4.27 shows it has more than enough assets to cover its short-term liabilities, indicating solid liquidity.