Market News How it works Learn FAQ
| GPUS 0.1689 34.05% | XXII 0.1977 -8.34% | SHFS 0.1324 -61.39% | NVD 4.19 0.96% | LUCD 0.411 25.42% | SPCX 147.49 1.89% | T 20.93 -7.96% | SOXL 83.56 1.77% | NU 15.16 2.92% | NOK 8.14 3.30% | EWZ 42.59 1.77% | NVDA 210.96 -0.59% | RIME 0.106 -12.90% | INTC 86.96 1.72% | TSLG 4.87 -1.62% | AAL 12.11 -3.89% | BBD 4.07 3.04% | STLA 4.06 -4.81% | SOXS 52.46 -1.85% | RWM 14.55 0.34% | HYG 77.05 -0.06% | MYND 0.24 47.42% | BITO 10.83 -0.28% | SPDN 8.54 0.47% | YFOR 0.2236 -1.58% | RBNE 0.19 -2.56% | TQQQ 66.29 -0.20% | VZ 44.66 -1.19% | TSLL 9.76 -1.21% | SPTI 27.63 -0.11% | YMAT 2.05 6.77% | CRWV 54.235 -2.46% | INFY 12.35 -6.58% | RIG 6.41 5.43% | F 11.6 -2.85% | SQQQ 39.68 0.20% | AIOK 12.02 182.82% | ONDS 6.2 2.99% | AAPL 347.725 -0.14% | LABT 0.31 -36.67% | CDE 13.45 -3.10% | PCG 12.63 -2.70% | GRAB 2.79 -2.11% | SOFI 14.615 -1.05% | XLE 69.33 2.60% | IREN 24.905 -2.37% | QID 14.55 0.14% | RKT 11.73 -0.09% | WULF 11.32 0.00% | BE 193.3 -11.24%
RYRyerson Holding Corporation logo

Ryerson Holding Corporation (RYI)

New York Stock Exchange · Currency in USD
$23.17 ▼ -0.26 (-1.11%)
At close: Mar 11, 9:30 AM ET. Market closed.

Summary

Previous Close
$23.43
Open
$23.23
Day's Range
$22.32 – $23.48
52 Week Range
$19.02 – $30.90
Volume
609,816
Avg. Volume
409,444
Market Cap
$746.35M
Beta (5Y Monthly)
1.59
PE Ratio (TTM)
--
EPS (TTM)
-$1.02
Earnings Date
--
Forward Dividend & Yield
$0.75 (3.24%)
Ex-Dividend Date
Sep 3, 2026
1y Target Est
$38.00

Profile: Ryerson Holding Corporation

Sector
Industrials
Industry
Manufacturing - Metal Fabrication
Full-time employees
4,200
CEO
James J. Claussen

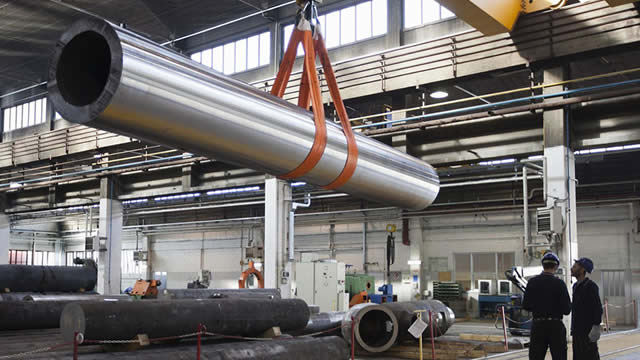
Ryerson Holding Corporation, along with its various operating entities, specializes in the processing and supply of industrial metals. The company's operations span several international markets, including the United States, Canada, Mexico, and China. It offers a broad selection of metal products, comprising carbon, stainless, and alloy steels, in addition to aluminum, nickel, and red metals.


Earnings

DateEst.Actual
Feb 19, 2026-$0.65-$1.01Miss
Oct 28, 2025-$0.18-$0.46Miss
Jul 29, 2025$0.11$0.08Miss
Apr 30, 2025-$0.23-$0.18Beat
Feb 20, 2025-$0.48-$0.14Beat
Oct 29, 2024$0.06-$0.20Miss

Analyst view

Consensus price target
$38.00 ▲ +64.0%
Range $31.00 – $45.00
Rating: Hold
Buy 0% · Hold 78% · Sell 22%

Get free alerts on RYI and big market moves

Free special alerts by text & email on new investment opportunities, buyouts and the stocks moving most, in plain English.
Get free stock alerts →
Data: Financial Modeling Prep. For information only, not investment advice.