
 Kirby McInerney LLP Alerts Investors Who Acquired Honeywell Aerospace Inc. HONA Securities Between June 29, 2026 and September 1, 2026 of Pending LawsuitGlobeNewsWire · 1 day ago
 Integra LifeSciences Holdings Corporation Investigation Continues: Investors May Contact Kirby McInerney LLP, a Securities Fraud Law Firm, If You Lost Money On Your IART InvestmentsNewsfile Corp · 2 days ago
 United Airlines CEO Scott Kirby doubles down on wealth tax support as a 'matter of fairness'Fox Business · 2 days ago
 United ‘Still Solidly Profitable' as Fuels Costs Rise, CEO Kirby SaysBloomberg Markets and Finance · 2 days ago
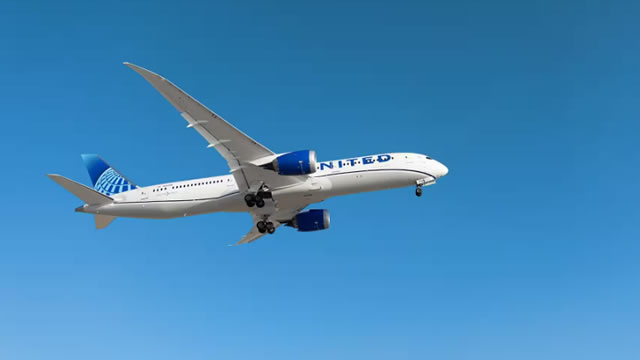 United CEO Kirby Defends Support of a US Wealth TaxBloomberg Markets and Finance · 2 days ago
 Kirby (KEX) Earnings Expected to Grow: What to Know Ahead of Next Week's ReleaseZacks Investment Research · 3 days ago
Kirby Corporation is a leading operator of domestic tank barges within the United States. Its Marine Transportation division specializes in moving bulk liquid products, providing comprehensive marine transport and towing services. These operations cover an extensive network, including the Mississippi River System, the Gulf Intracoastal Waterway, all three U.S. coastlines, and extend to Alaska and Hawaii.
| Date | Est. | Actual | |
|---|---|---|---|
| Jul 29, 2026 | $1.63 | $1.67 | Beat |
| Apr 30, 2026 | $1.41 | $1.50 | Beat |
| Jan 29, 2026 | $1.62 | $1.68 | Beat |
| Oct 29, 2025 | $1.63 | $1.65 | Beat |
| Jul 31, 2025 | $1.59 | $1.67 | Beat |
| May 1, 2025 | $1.27 | $1.33 | Beat |