 GE Vernova Stock Fell 11% in a Day. Here's What I Think It Could Be Worth by 2030.The Motley Fool · 3 hr ago
 The AI Power Bill Comes Due: Will GE Vernova's Q3 Earnings Oct. 28 Prove Its $176B Backlog Is Real?24/7 Wall Street · 8 hr ago
 This $6 Billion Investment Could Open a Relief Valve for America's AI and Power-Grid Boom24/7 Wall Street · 10 hr ago
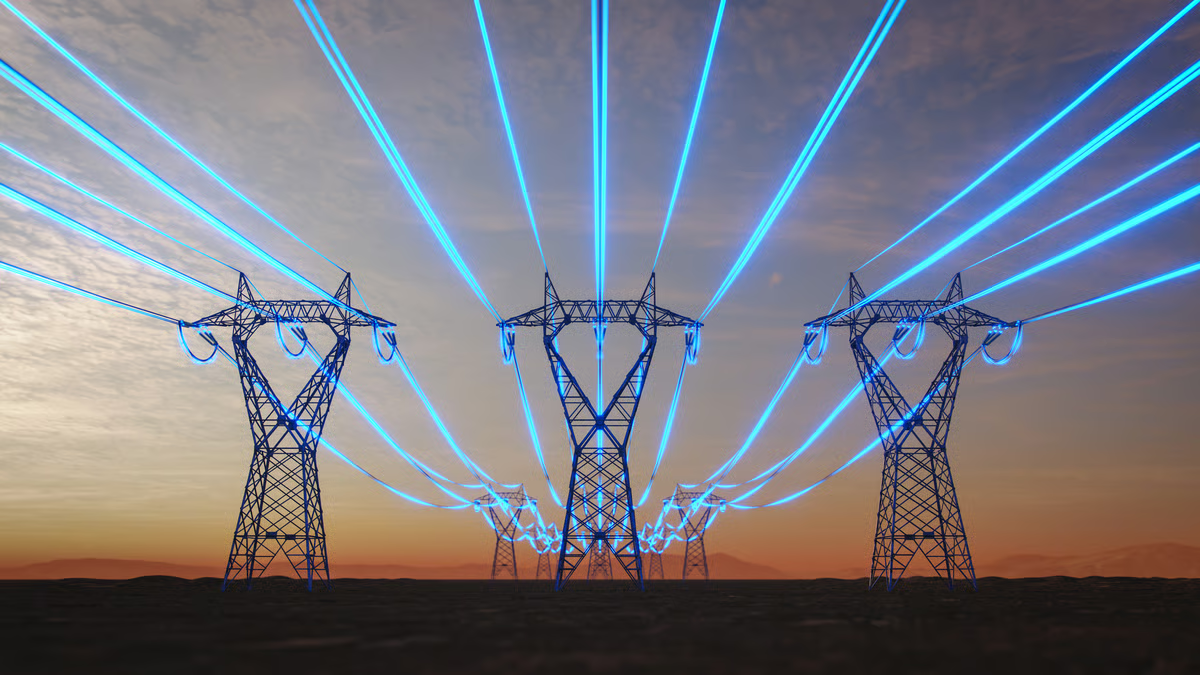 U.S. Power Demand Is Set to Jump 20% by 2030. Here's What It Means for Energy Stocks.Fool - Investing News · 12 hr ago
 GE Vernova (GEV) Suffers a Larger Drop Than the General Market: Key InsightsZacks Investment Research · 1 day ago
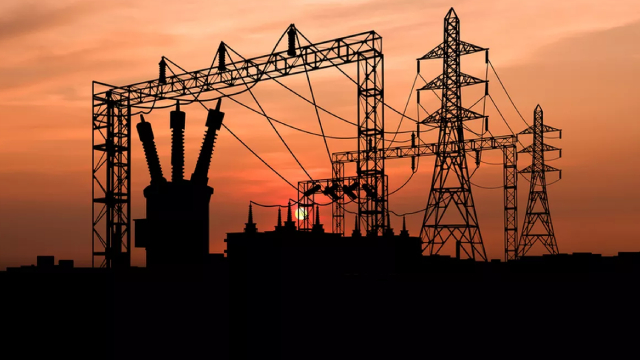 Constellation Energy vs. GE Vernova: Which Utilities Stock Is a Better Buy in 2026?The Motley Fool · 1 day ago
GE Vernova Inc. is an energy enterprise primarily engaged in generating electricity. Its business activities are categorized into three main divisions: Power, Wind, and Electrification. The Power segment is responsible for producing and distributing electricity from various sources, including hydroelectric, natural gas, nuclear, and steam power.
| Date | Est. | Actual | |
|---|---|---|---|
| Jul 22, 2026 | $3.17 | $2.47 | Miss |
| Apr 22, 2026 | $1.95 | $17.44 | Beat |
| Jan 28, 2026 | $2.93 | $13.39 | Beat |
| Oct 22, 2025 | $1.72 | $1.64 | Miss |
| Jul 23, 2025 | $1.48 | $1.86 | Beat |
| Apr 23, 2025 | $0.47 | $0.91 | Beat |