 5 Top Dividend Stocks Yielding 5% or More to Buy Right Now for Passive IncomeFool - Investing News · 8 hr ago
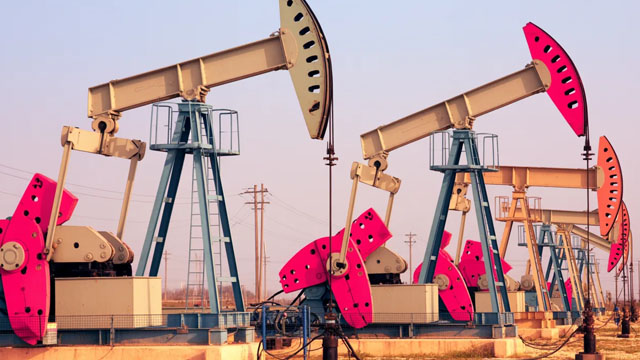 Pipeline Stocks Keep Paying Big Dividends. Here's the Risk Beneath the Surface24/7 Wall Street · 1 day ago
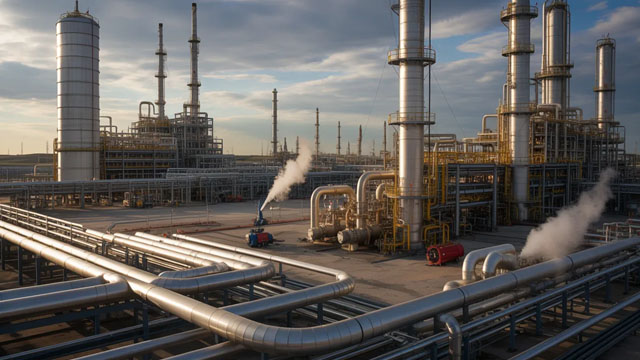 3 Safe Stocks Increasing Dividends: Buy Before October Ends for an Instant 6.5%+ Yield24/7 Wall Street · 1 day ago
 2 No-Brainer High-Yield Energy Stocks to Buy Right Now, Starting With Energy TransferThe Motley Fool · 2 days ago
 This Energy Giant's High Dividend Yield Is Backed by an Important Number24/7 Wall Street · 2 days ago
 Enterprise Products Covers Its Payout 1.9 Times. These 4 Dividend Stocks Also Deserve a Look24/7 Wall Street · 2 days ago
Enterprise Products Partners L.P. delivers essential midstream energy services, connecting both producers and consumers of diverse commodities such as natural gas, natural gas liquids (NGLs), crude oil, petrochemicals, and refined products. Its operations are structured across four distinct business segments: NGL Pipelines & Services, Crude Oil Pipelines & Services, Natural Gas Pipelines & Services, and Petrochemical & Refined Products Services. The NGL Pipelines & Services division focuses on natural gas processing and associated NGL marketing.
| Date | Est. | Actual | |
|---|---|---|---|
| Jul 30, 2026 | $0.75 | $0.84 | Beat |
| Apr 28, 2026 | $0.71 | $0.68 | Miss |
| Feb 3, 2026 | $0.69 | $0.75 | Beat |
| Oct 30, 2025 | $0.65 | $0.61 | Miss |
| Jul 28, 2025 | $0.65 | $0.66 | Beat |
| Apr 29, 2025 | $0.71 | $0.64 | Miss |