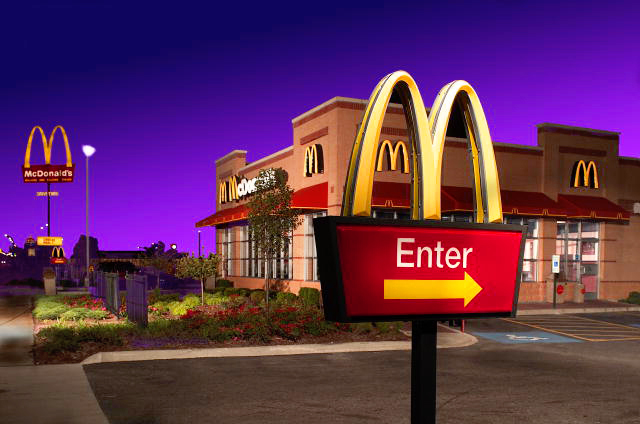
MTY Food Group Inc., trading under the symbol PNK:MTYFF on the OTC exchange, is a prominent player in the food industry, known for its diverse portfolio of restaurant brands. The company operates thousands of locations worldwide, offering a variety of dining experiences. MTYFF competes with other major food service companies, striving to maintain its market position through strategic growth and financial performance.
On October 10, 2025, MTYFF reported its earnings before the market opened. The company achieved an earnings per share (EPS) of $0.866, slightly below the estimated $0.89. Despite this, MTYFF exceeded revenue expectations, generating approximately $216.06 million compared to the estimated $195.15 million. This revenue performance highlights the company's ability to drive sales growth, even when earnings fall short of projections.
During the Q3 2025 earnings call, CEO Eric Lefebvre and CFO Renée St-Onge discussed the company's financial results. MTY Food Group reported a 2% increase in segment profits, reaching $73.2 million. However, net income attributable to owners declined to $27.9 million, or $1.22 per diluted share, from $34.9 million, or $1.46 per diluted share, in the same quarter of the previous year. This decline reflects challenges in managing costs and maintaining profitability.
Despite these challenges, MTY's normalized adjusted EBITDA rose by 3% to $74 million, compared to $71.9 million in the previous year. The company also reported a positive shift in its store network, with a net opening of 15 locations in Q3-25, contrasting with a net closure of 41 locations in Q3-24. By the end of the quarter, MTY operated 7,061 locations, indicating a strategic focus on expanding its footprint.
MTYFF's financial metrics provide further insight into its market valuation. The company has a price-to-earnings (P/E) ratio of approximately 20.21, reflecting the market's valuation of its earnings. Its price-to-sales ratio stands at about 0.66, suggesting that the market values the company's sales at less than one times its revenue. The enterprise value to sales ratio is around 1.63, indicating the company's total valuation relative to its sales. These figures, along with a debt-to-equity ratio of approximately 1.47, highlight MTYFF's financial structure and market perception.