- Wingstop Inc. (NASDAQ: WING) demonstrates strong capital efficiency with an ROIC of 25.05%, significantly exceeding its WACC of 10.18%.
- Its ROIC to WACC ratio of 2.46 highlights excellent investment returns and an efficient business model within the competitive fast-food industry.
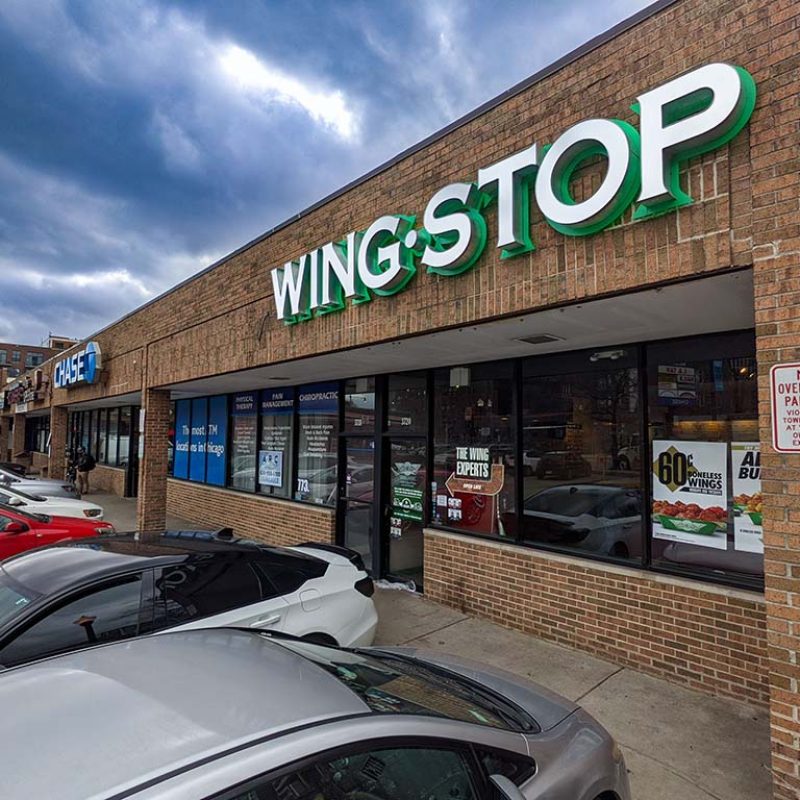
Wingstop Inc. is a popular restaurant company known for its flavor-packed, made-to-order chicken wings. In the competitive fast-food space, a key measure of success is how well a company uses its money. We can analyze this by comparing its Return on Invested Capital (ROIC) to its cost of capital.
Return on Invested Capital, or ROIC, shows how much profit a company generates from the money invested in its operations. This is compared to the Weighted Average Cost of Capital (WACC), which is the average cost for a company to raise that money. A company creates value if its ROIC is higher than its WACC.
Wingstop demonstrates a remarkable ability to create value. It has an ROIC of 25.05%, which is significantly higher than its WACC of 10.18%. This gives Wingstop a strong ROIC to WACC ratio of 2.46, meaning it generates excellent returns on its investments and operates a very efficient business model, showcasing strong financial performance.
When compared to its peers, Wingstop holds a strong position in the competitive landscape. Domino's Pizza is the clear leader with an incredible ROIC to WACC ratio of 8.52. However, Wingstop’s ratio of 2.46 is also very impressive, placing it well ahead of competitors like Jack in the Box at 1.77 and Papa John's at 1.46.
Not all competitors are creating value as effectively. Shake Shack shows a ratio of only 0.27. A ratio below 1.0 indicates that a company's returns are not enough to cover its cost of capital. This suggests potential challenges in Shake Shack's current strategy compared to its more efficient peers, impacting its shareholder value.