- V.F. Corporation reported a Q1 2026 loss per share of -$0.27, missing analyst estimates of -$0.22.
- Quarterly revenue declined by 5.2% year-over-year to $1.67 billion, though it surpassed internal guidance.
- Key valuation metrics include a tPrice-to-Sales ratio of 0.62, alongside a Debt-to-Equity ratio of 2.81.
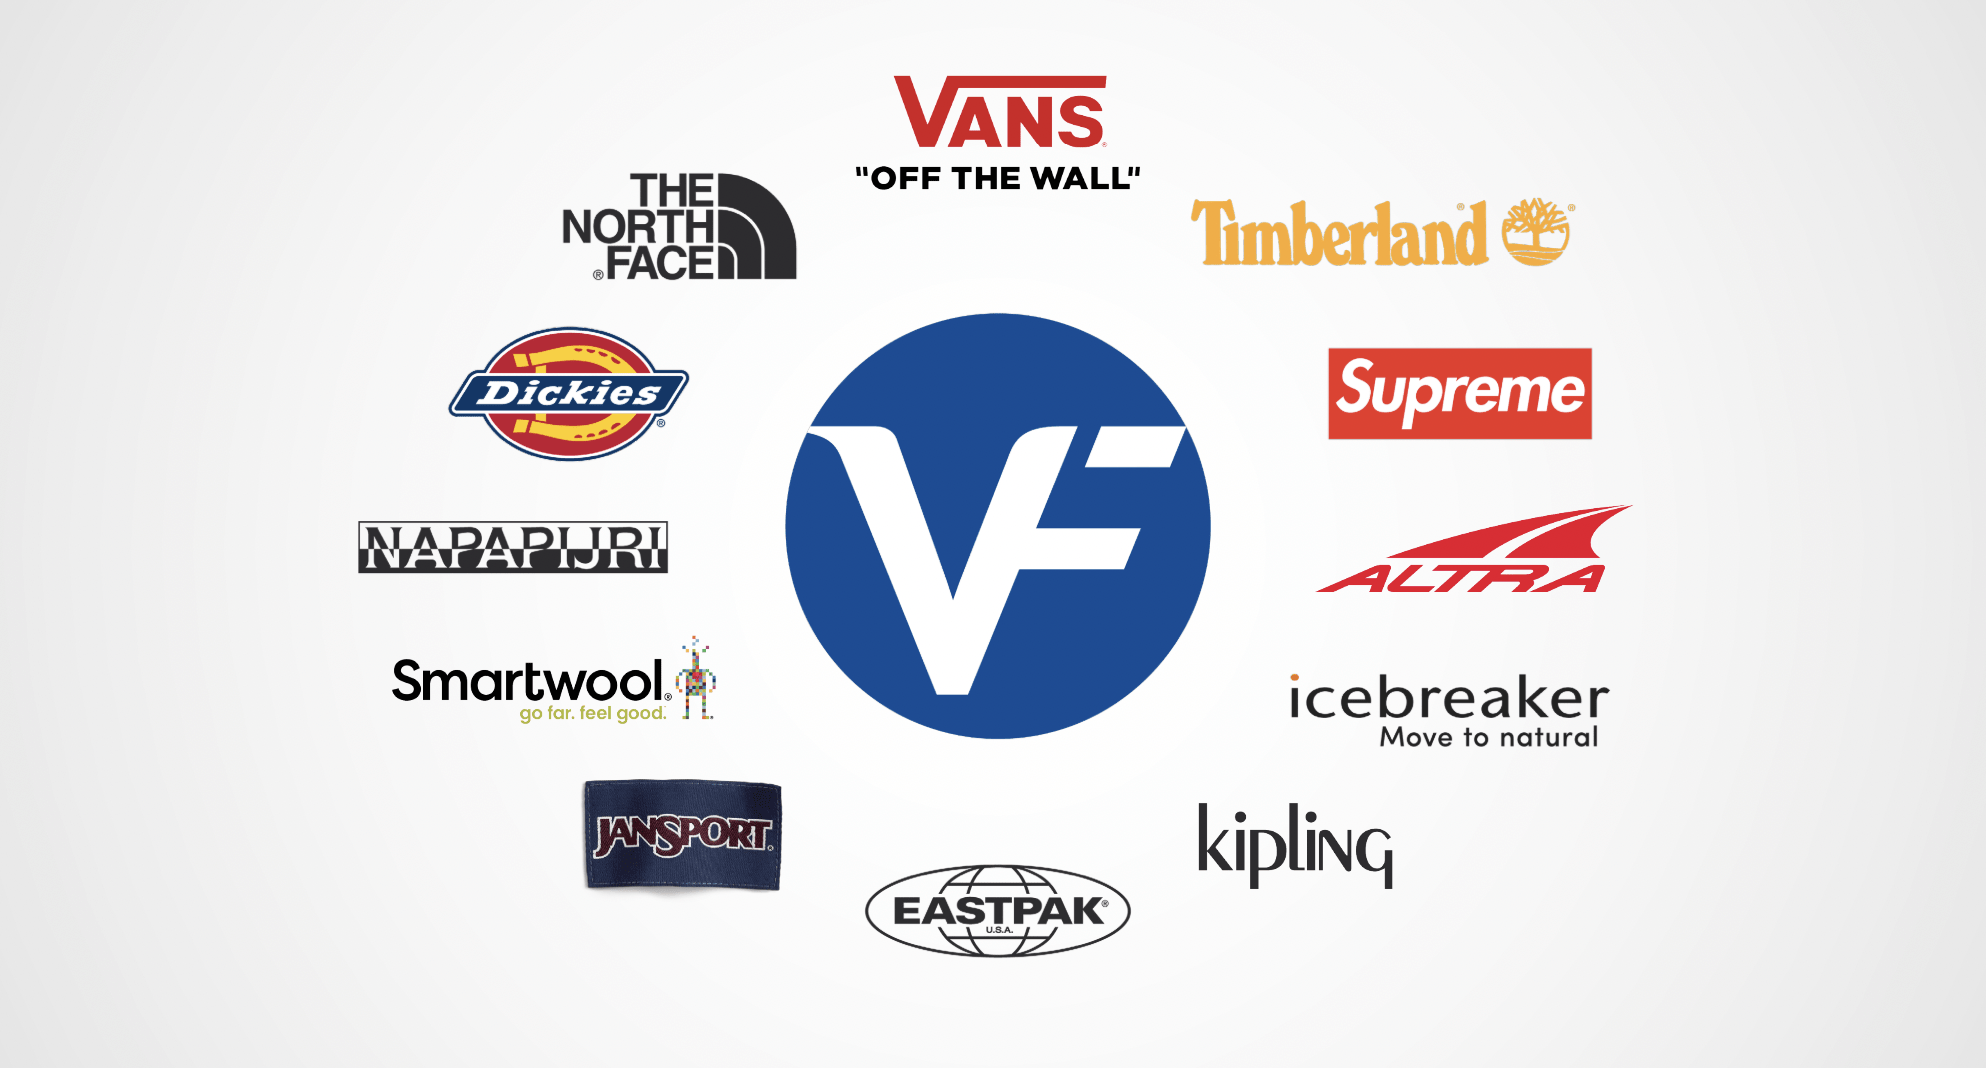
V.F. Corporation (NYSE: VFC) is a global apparel and footwear company. It manages a diverse portfolio of well-known outdoor and active lifestyle brands. These brands include Vans, The North Face, and Timberland, which are popular worldwide. The company regularly reports its financial performance to investors.
On July 29, 2026, V.F. Corporation announced its quarterly earnings. The company reported a loss per share of -$0.27, which did not meet the analyst consensus estimate of a -$0.22 loss. As highlighted by Zacks Investment Research, this represents an earnings surprise of -22.73% and is a larger loss than the -$0.24 per share reported in the same quarter a year ago.
For the quarter, V.F. Corporation's revenue reached $1.67 billion. This figure represents a 5.2% decline from the previous year. It also narrowly missed the Zacks Consensus Estimate by 0.29%. However, as highlighted by Business Wire, the company stated that these results were delivered ahead of its own internal guidance. V.F. Corporation also has a Price-to-Sales ratio of 0.62, which compares its stock price to its revenues.
From a financial health perspective, V.F. Corporation has a Debt-to-Equity ratio of 2.81. This metric shows the company's reliance on debt to finance its assets compared to the value of its stockholders' equity. The company’s current ratio of 1.43 suggests it has sufficient assets to cover its short-term liabilities.