- F5, Inc. is set to announce its quarterly earnings report on July 27, 2026, a key date for investors monitoring application security solutions.
- The consensus projects revenue of $834.60 million and earnings per share (EPS) of $4.00, with company guidance largely in line.
- Analysts maintain positive ratings, highlighting F5, Inc.'s robust financial health, including a low Debt-to-Equity ratio of 0.07.
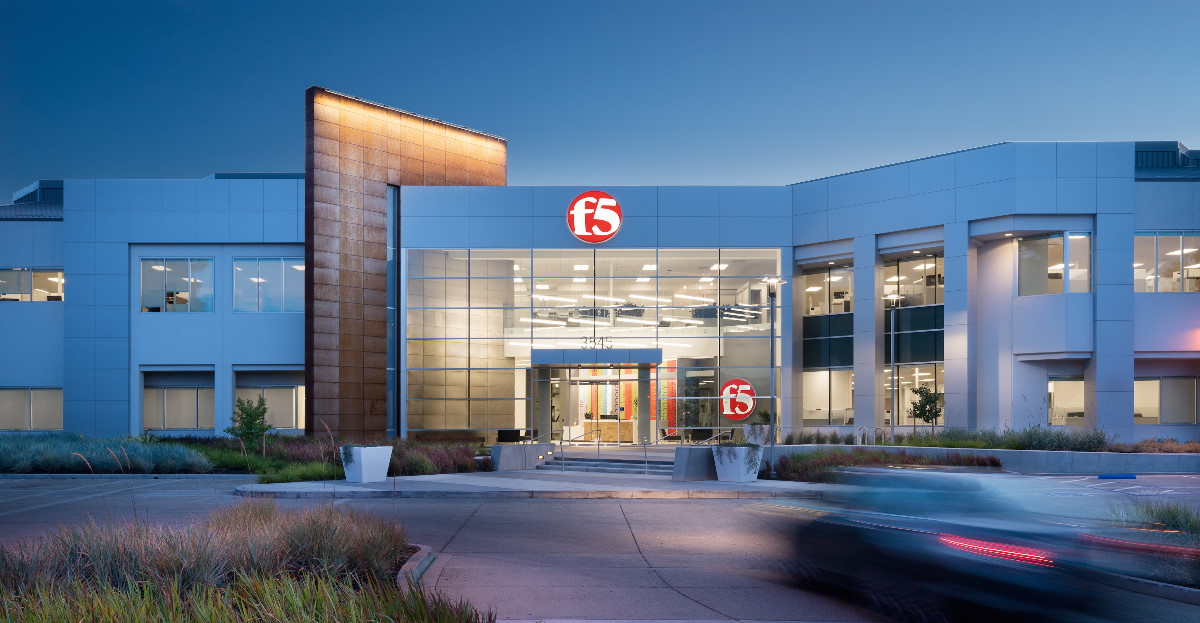
F5, Inc. (NASDAQ: FFIV) is a leading technology company specializing in application security solutions and delivery services. It empowers businesses to manage and secure their critical applications across diverse environments, supporting their digital transformation journeys. The company is scheduled to release its quarterly earnings report on July 27, 2026, after the market closes, an event closely watched by investors seeking insights into its market performance.
Wall Street's consensus estimate projects revenue of approximately $834.60 million for the quarter. This aligns with a forecast of $833.62 million, as highlighted by Benzinga Pro, which would be an increase from the $780.37 million reported in the same period last year. F5, Inc. itself projects revenue between $820.00 million and $840.00 million.
For earnings, the consensus estimate is an earnings per share (EPS) of $4.00. This is a slight decrease from the $4.16 per share reported a year ago. EPS represents a company's profit divided by its outstanding shares, indicating its profitability on a per-share basis. F5, Inc.'s own guidance is for an EPS between $3.91 and $4.03.
Ahead of the report, analysts are adjusting their views. RBC Capital analyst Matthew Hedberg maintains an Outperform rating and raised the price target for F5, Inc. to $450.00. This shows confidence from some analysts. The stock recently saw a 1.1% increase, closing at $392.21 on Friday, reflecting current market sentiment.
The company's financial health can be viewed through several key financial metrics. It has a Price-to-Earnings (P/E) ratio of 32.39, which compares the stock price to its earnings. Additionally, F5, Inc. maintains a low Debt-to-Equity ratio of 0.07, suggesting it relies more on equity than debt to finance its assets, indicating a strong balance sheet.