- SolarEdge Technologies reported a significant EPS miss, with a quarterly loss of $0.43 per share against an expected -$0.23.
- The company demonstrated strong revenue performance, surpassing estimates with $310.50 million in revenue, a 2.33% beat.
- Key financial indicators reveal a negative trailing P/E ratio of -6.54, a P/S ratio of 1.94, and a healthy current ratio of 2.02, reflecting its current market valuation and liquidity.
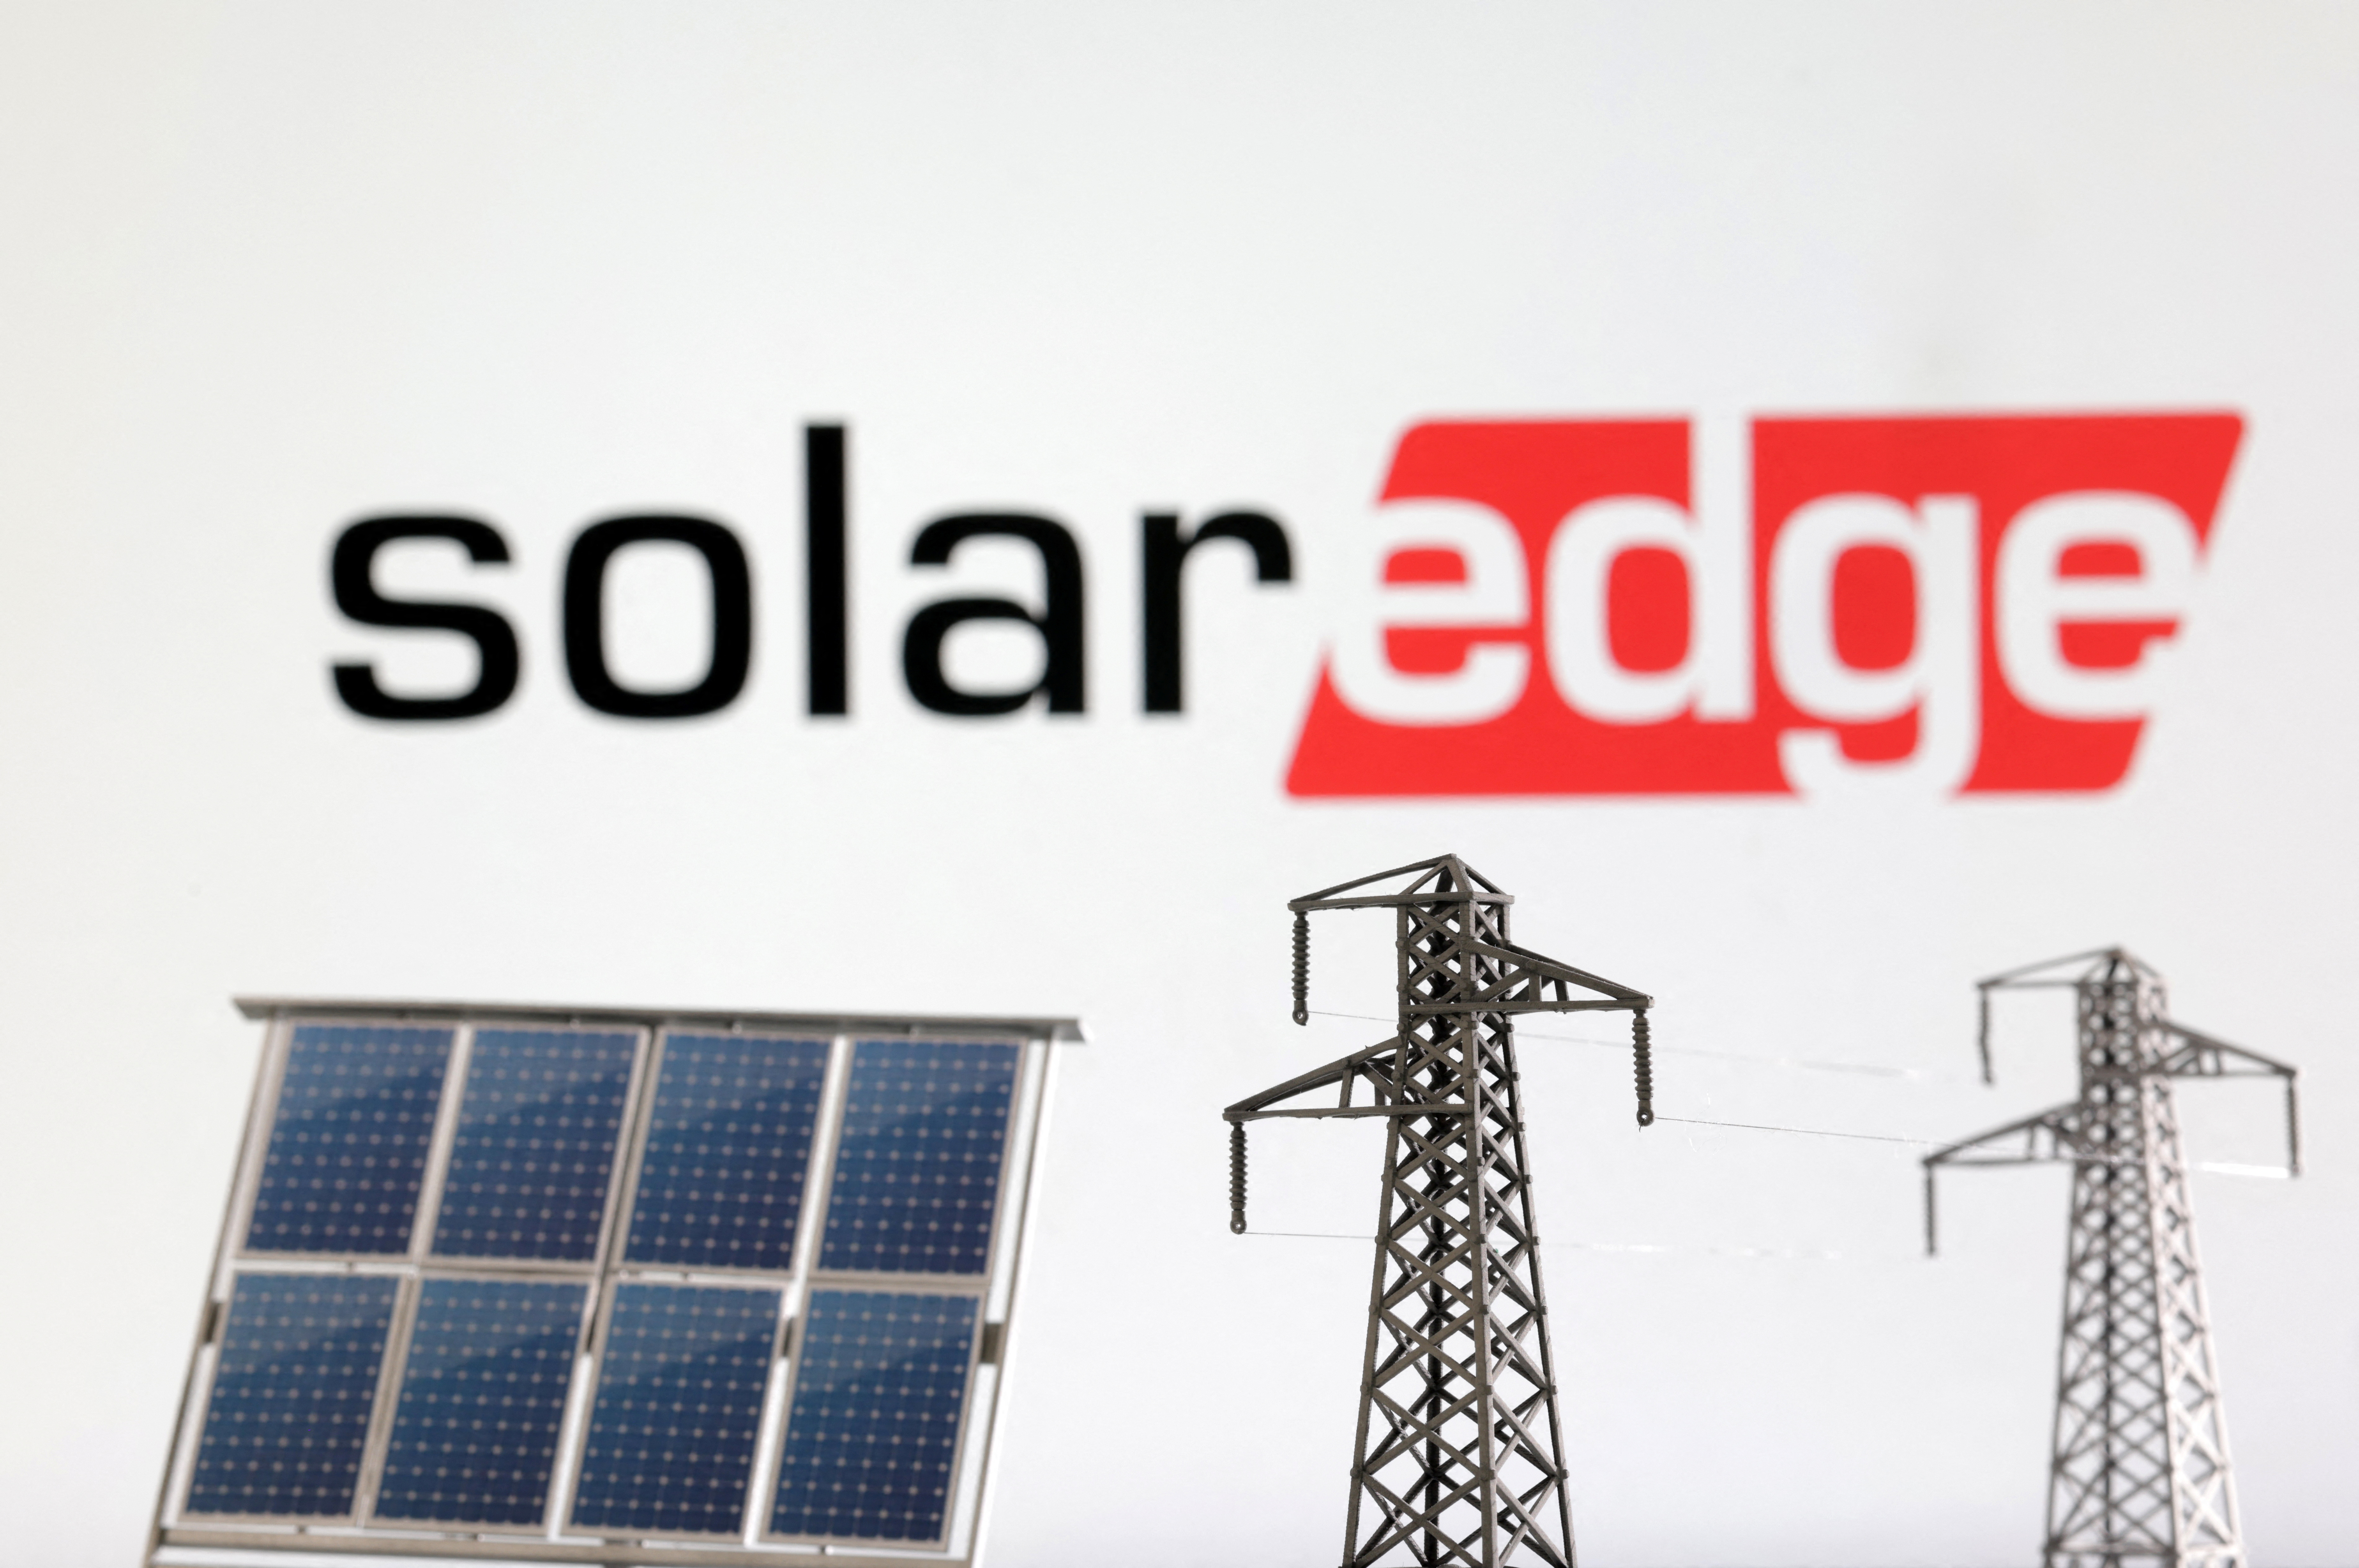
SolarEdge Technologies (NASDAQ:SEDG) is a global leader in smart energy technology. The company provides advanced solar inverter solutions, which are crucial for managing and monitoring solar energy production. It operates in a competitive renewable energy market alongside companies like Enphase Energy (NASDAQ:ENPH), focusing on optimizing power from solar panel systems for residential, commercial, and utility-scale use.
Ahead of its May 7, 2026, earnings release, analysts expected an earnings per share (EPS) of -$0.23. However, SolarEdge Technologies reported a quarterly loss of $0.43 per share, missing the consensus estimate, as highlighted by Zacks. This result is an improvement from the $1.14 per share loss reported in the same quarter last year.
Wall Street's consensus revenue estimate for SolarEdge Technologies was $306.97 million. The company surpassed this by posting revenues of $310.50 million, a 2.33% beat. This figure also represents a significant 46% year-over-year increase from $219.48 million, although it is a 7.40% decrease from the previous quarter's $335.40 million.
The company's financial data shows a negative trailing Price-to-Earnings (P/E) ratio of -6.54. A negative P/E ratio indicates that the company has experienced negative earnings over the past twelve months. Its Price-to-Sales (P/S) ratio, which compares the stock price to revenues, stands at 1.94.
Looking at its balance sheet, SolarEdge Technologies has a Debt-to-Equity ratio of 0.95. The company's liquidity appears healthy with a current ratio of 2.02. A current ratio above 1 suggests a company has enough current assets, like cash and inventory, to cover its short-term obligations or liabilities.