- Check Point Software is currently under investigation for potential securities law violations, adding a layer of uncertainty for investors.
- The company reported mixed Q1 2026 financial results, with strong earnings per share of $2.50 surpassing estimates, but quarterly revenue of $668.40 million falling short of expectations.
- Key financial health indicators for Check Point Software include a price-to-earnings (P/E) ratio of 11.62, a price-to-sales ratio of 4.40, and a healthy current ratio of 2.05.
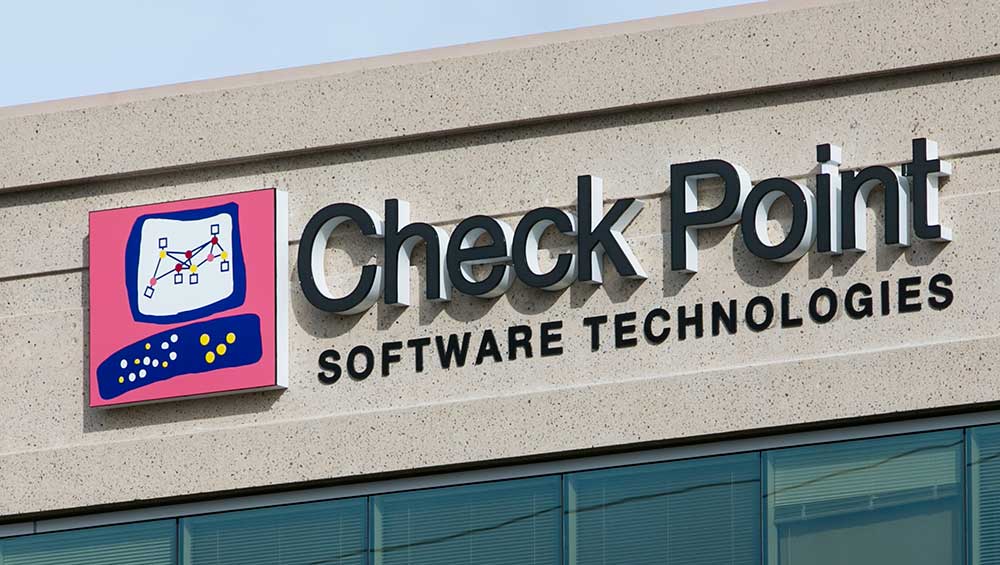
Check Point Software (NASDAQ: CHKP) is a cybersecurity company that provides services to protect corporate networks from digital threats. The company is currently under investigation by the law firm Block & Leviton for potential securities law violations, as highlighted by GlobeNewswire. This comes at a time when the company is reporting mixed financial results for its recent quarter.
On April 30, 2026, Check Point Software announced an earnings per share (EPS) of $2.50, which was higher than the consensus estimate of $2.42. This represents a 13% increase in its first-quarter profit, as reported by Reuters. The growth was mainly driven by a double-digit increase in revenue from its security subscriptions.
Despite the strong earnings, the company's quarterly revenue of $668.40 million did not meet the estimated $672.71 million. As noted by Investors.com, both revenue and billings fell short of expectations, causing the company's stock to decline. Following this, Check Point Software also reduced its revenue forecast for the full year of 2026.
Looking at its financial health, Check Point Software has a price-to-earnings (P/E) ratio of 11.62. The P/E ratio is a metric used to value a company by measuring its current share price relative to its per-share earnings. The company also has a price-to-sales ratio of 4.40, which compares the stock price to its revenues.
The company's debt-to-equity ratio is 0.68, which compares its total liabilities to its shareholder equity and is often used to evaluate its financial leverage. A lower ratio generally indicates less risk. Furthermore, Check Point Software has a current ratio of 2.05, suggesting it has enough current assets to cover its short-term liabilities.